In this post, we share some of the key ideas discussed during our May 2019 PAC meet-up where we introduced the concepts behind the Parallax Business Insights Platform.
In our line of work, we get really good at the process of triage.
Our customers and our employees are always the first priority. This lends itself nicely to the habit of managing things as they come up. Some of the best leaders in the biz are like WWII triage docs, they can quickly work through the priorities of the day and provide maximum value all the time. Your leaders are super smart and effective at their jobs. Where they focus their time indicates where they make an impact.


How can we create systematic balance reacting to the immediate needs of the business with some focus on strategy?
How would you and your team “react” to more balanced data informing our priorities?
Over the years you’ve developed instincts and a very strategic eye for prioritization. It’s allowed you to make smart investments in the future while managing the day to date. However, that’s hard to scale. We believe that with the right set of insights we can help balance the visibility of strategic opportunities with the immediate needs of the operation.

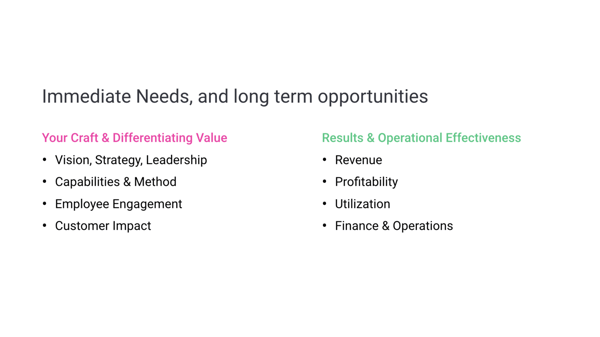
The best services business in the world balance immediate needs with long term opportunities.
How to prioritize focus
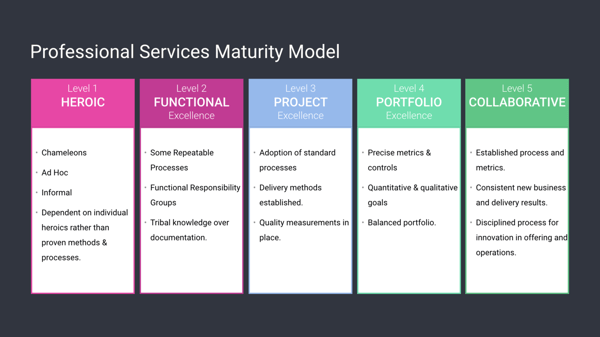
A source of inspiration for our team has been the benchmark developed by an organization called SPI Research. They built the Professional Services Maturity Model years ago and have been refining it every year with help from an annual survey they administer. The two seasoned industry vets have done a really nice job calling out some of the common patterns and opportunities in our business. I encourage you to check it out.

SPI Research does a nice job on their maturity model. The punch line is that you want to be collaborative. :)
The Levels
The foundation for the maturity model is the five levels above. In their framework they’ve categorized companies From Heroic, where teams rely on the amazing talent on their team, to Collaborative, where organizations have established and constantly improving habits for collaborating across the silos of the business to grow and evolve.
If you want to avoid reading the whole dang thing, I’ll give you the punch-line — The best Professional Services companies in the world have a cultural habit of balancing repeatable process and metrics with consistent evolution of their service offerings. Our businesses have thin margins by nature, we tend to over-index on efficiency through control.
There’s a heck of a lot more detail in there than that, I’d be happy to hang out for hours and discuss, in the meantime I’ve shared the document for your enjoyment. I plan to publish my “cliff-notes” version as a blog post as soon as they give me permission.
The Metrics
A juicy part of their framework is the metrics they provide in the benchmark. It’s a great way to see how your results stack up to the highest performing companies in their survey. After interviewing 50+ COO/CFO/CEO, I believe these metrics are directionally correct and useful for considering opportunities for focus.

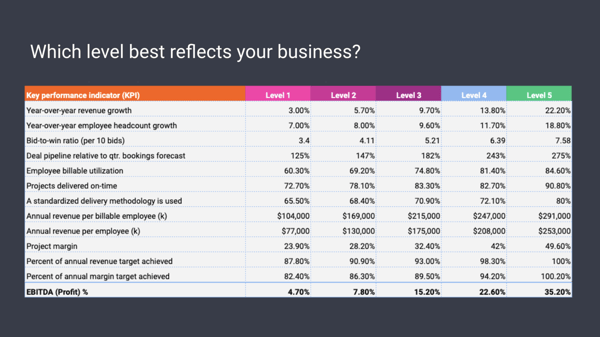
My personal opinion is that all but a couple of these metrics are lagging indicators. With a strong brand, vision, strategy, and execution, anyone can be a Level 5.
There are a couple that I think are really important to consider as leading indicators. The first is “standardized delivery methodology used”. I have a whole other blog post in the queue on this one, and I’d love to share this in detail. The short version, I think it’s extremely important that instead of trying to be everything to everybody, treating every project as a special snowflake, you should focus on two types of projects that you treat very differently internally.
-
Standardized Services: Projects using an existing methodology or capability that we’ve had consistent success in marketing, selling, and delivering.
-
Adjacent or Evolutionary Services: Projects near or adjacent to the usual work that are opportunities for you to evolve your business.
Where we can, we should build on previous success, developing artifacts and process to support the methodologies and experiences that have worked before. We should also explore adjacencies every day. Keeping a balance between each project type (such as 85% / 15% suggested in the Level 5) we can ensure we protect the bottom line while applying the appropriate amount of focus on the future.
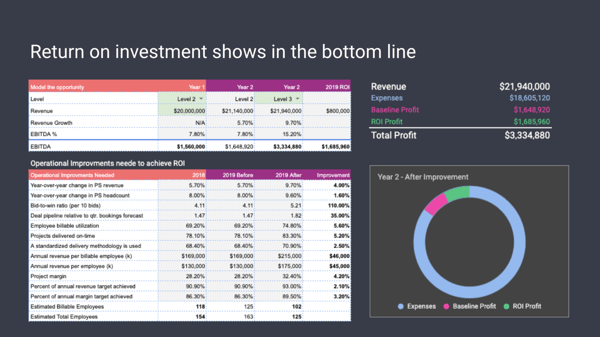
The Calculator
I built a little calculator to share that allows you to plug in your revenue and your current level. The calculated then shows you how the SPI metrics would change if you leveled up. Again, this is meant as a proactive tool more than anything. We’re looking at what happens after you fix stuff. Obviously, I am not suggesting you simply focus on improving utilization to get to 35% EBITDA.

What we know about our users.
Depending on the size of the organization there could be anywhere from one to three dozen user types. The way we think about it, there are three primary “hats” a user might be wearing using Parallax. Below I’ve included a brief on what we know about our primary hat wearers. ;)
Sales Leadership
When people are thinking about sales and business development they’re often focused on the needs of the customer and how we can address those needs.

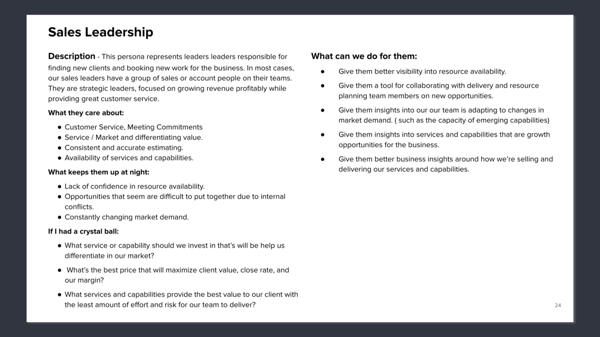
With our sales hat on, we’ve found that users want to know we’re meeting commitments and staying ahead of the customer’s needs.
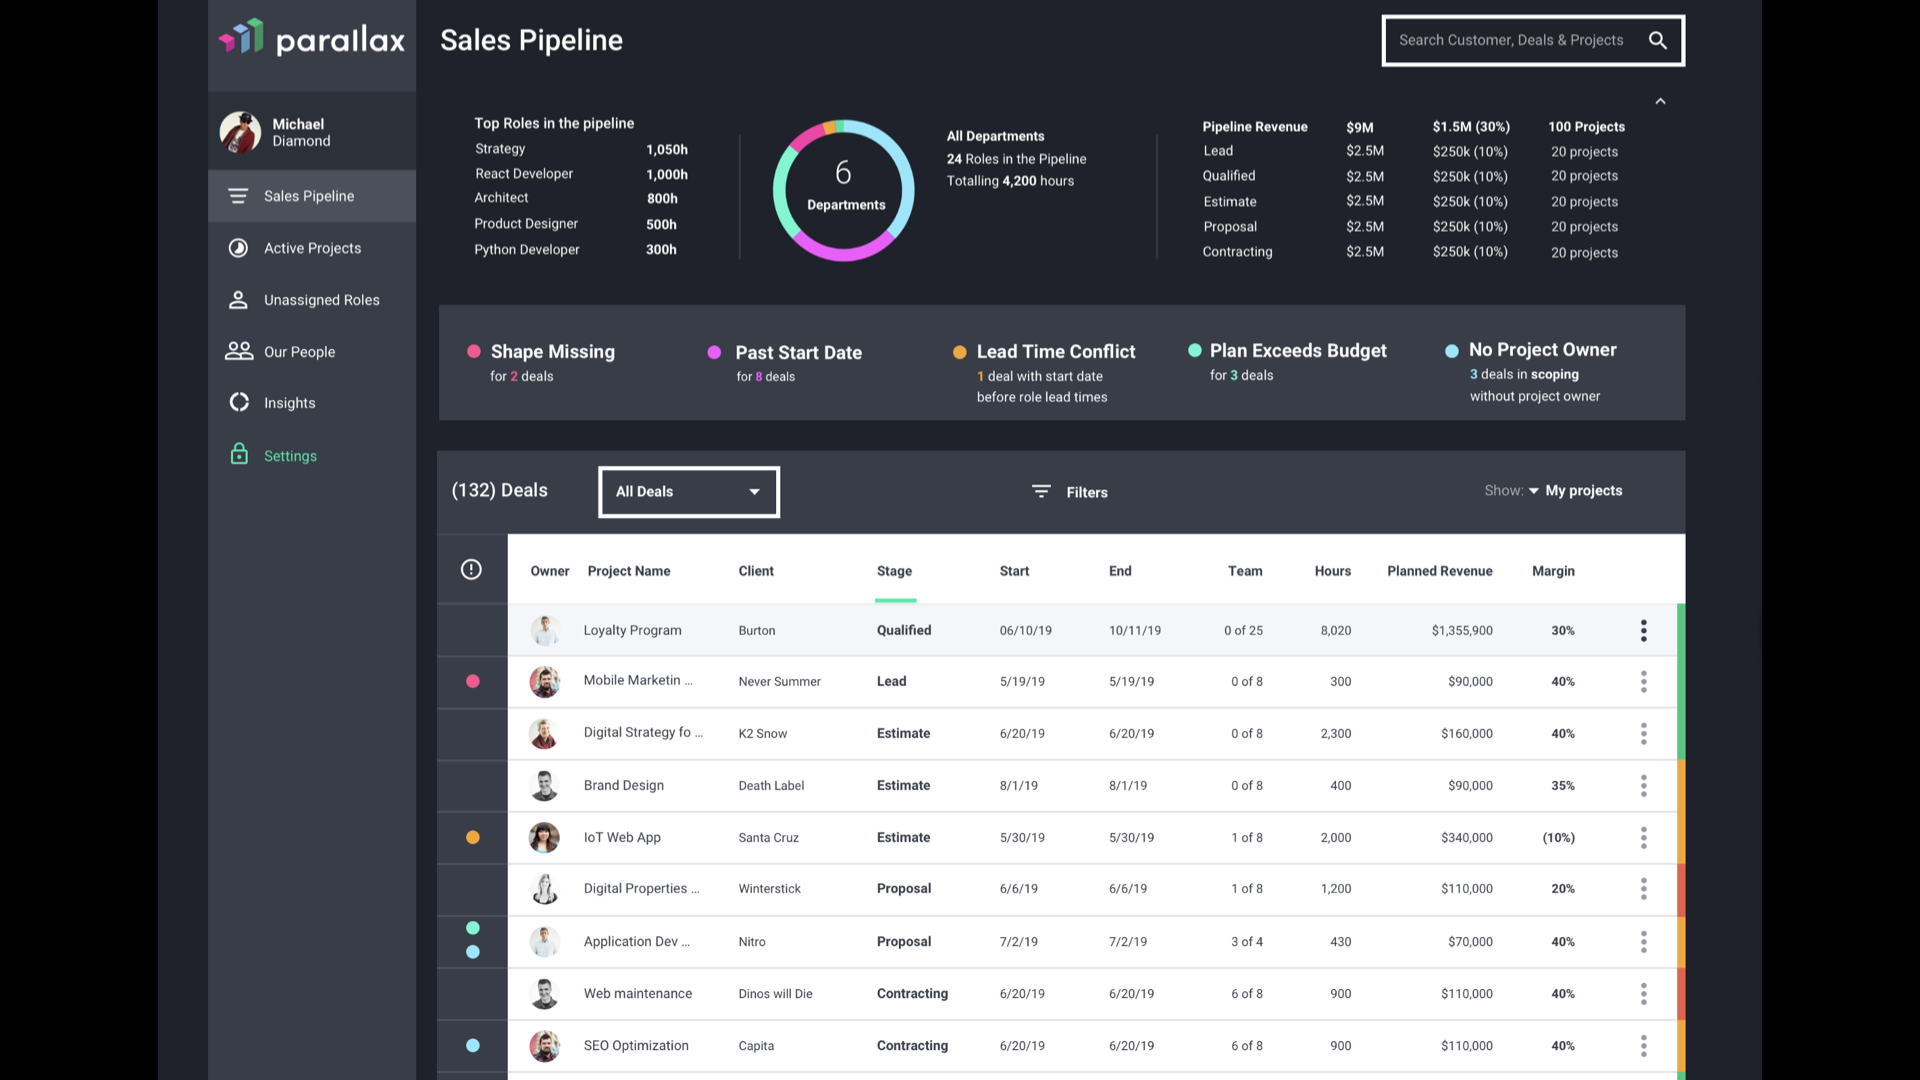
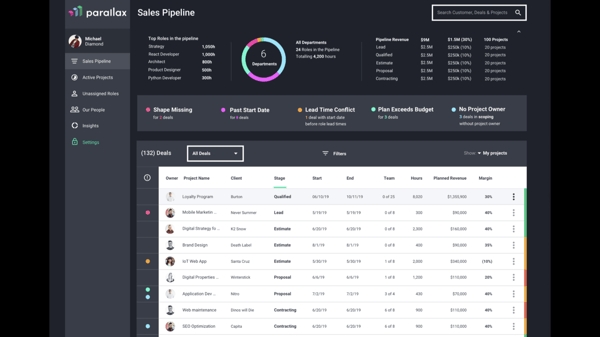
During the business development process, there are are certain calls to action or insights that should be available to prompt some of the operational priorities. In our listing of the sales pipeline, you’ll see some of the alerts we envision relevant to the opportunities we’re trying to sell. Along with a simple list of deals, we consider this view a bit of a dashboard related to the pipeline.
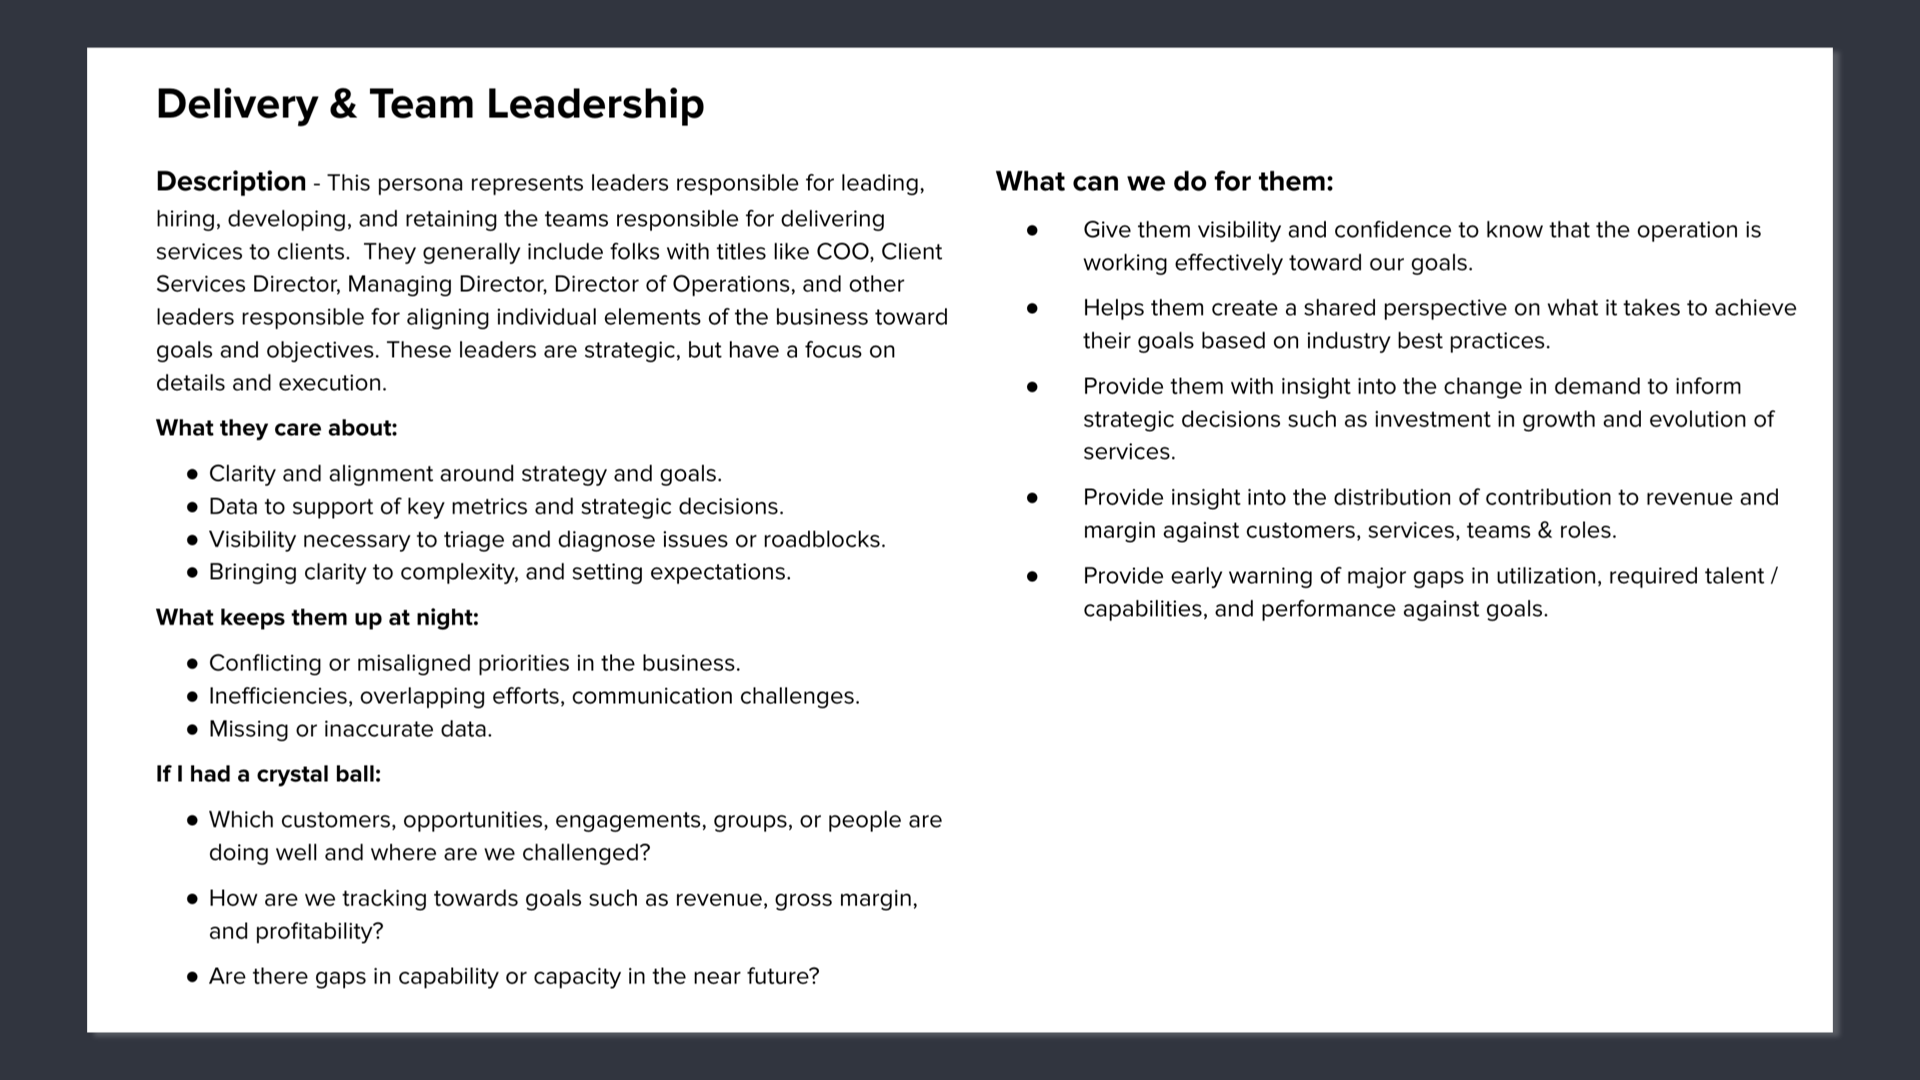
Delivery Leadership
The best delivery leaders can walk the line between customer focus and internal attention. A big part of that is making sure that we have the right people assigned to projects and that we set good expectations with customer and teams. In my experience, delivery leaders like words such as “alignment”. They want to make sure we’re making reasonable commitments that we can meet or exceed.
.png?width=600&name=image-asset%20(1).png)
Ultimately, our delivery team wants to be sure that we’re set up to succeed. That desire manifests in a bunch of different ways, communication and shared perspective is often the remedy.
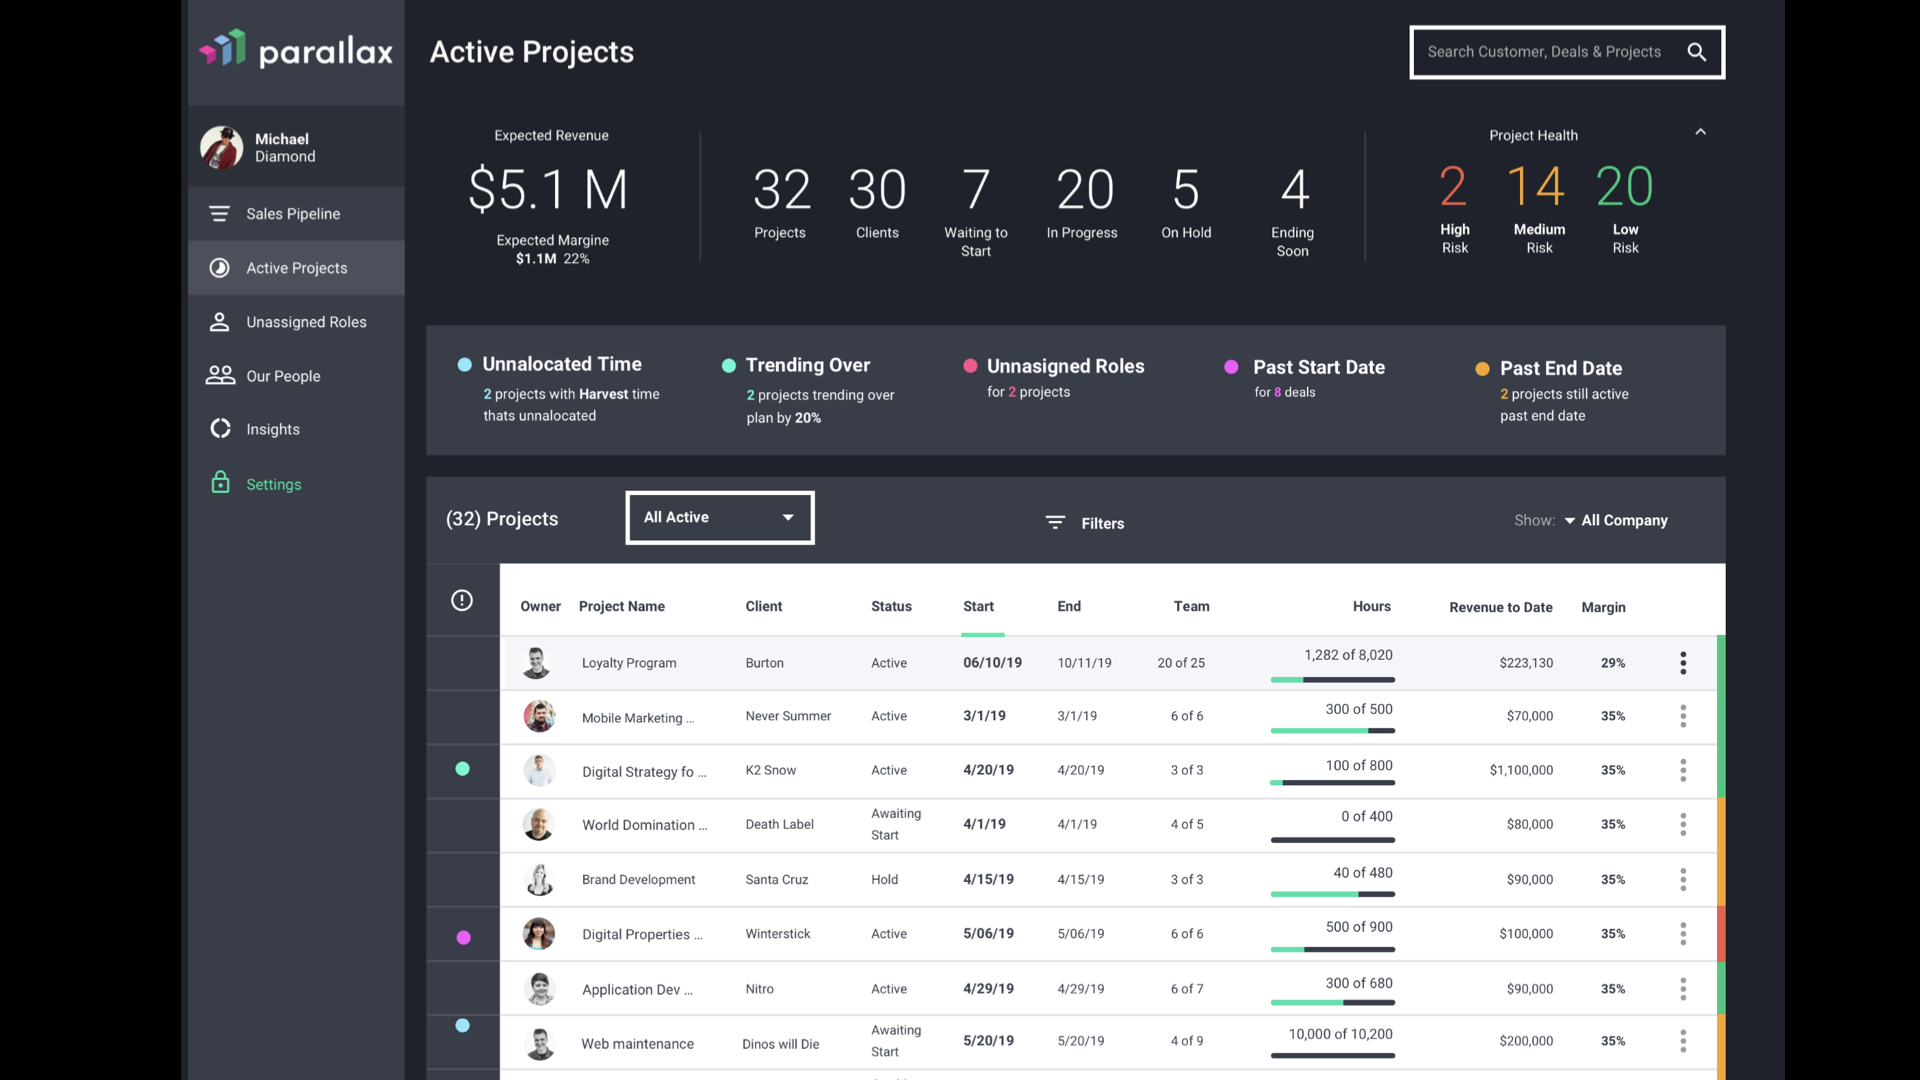
When we’re in delivery mode, there are other operational insights we desire. Most of these are relative to our desire to make sure we do a great job and deliver consistently. The alerts and insights on this view are pretty simple. Either related to having the right people assigned to projects or related to tracking toward plans.
.png?width=600&name=image-asset%20(2).png)
On the active projects view we’re calling out the projects with things like unassigned roles, unallocated time, or late to start. We also can see the general size of the backlog from the dashboard here.

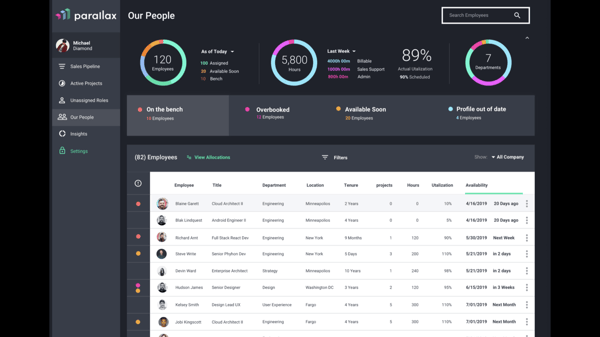
Team leads and resource planning folks want to see how demand impacts our people. On this simple list view, we’ve included some data points that might inform opportunities for people who are either under or over allocated.
Strategic Leadership
Most of the views we’ve reviewed so far help us identify the operational priorities of the business, similar to the triage doc. We believe that when leaders are wearing their Strategy hats, they should be asking different questions of their businesses. Strategic leaders are thinking about how their portfolio of experiences, capabilities, and methods reflect the current market opportunities. They’re thinking about the next horizon and the adjacencies to their current offerings that could be their next growth vein.

.png?width=600&name=image-asset%20(3).png)
Strategic leaders want to know if the operation is effectively and consistently meeting organizational objectives. They’re also thinking about what’s next.
Just a couple of examples of strategic questions for the business are pictured in views below. The first is a report that describes the growth of the core services in the business over the last two years. In this chart we can see that while some of the more mature services in the business such as Web CMS make up a great part of the revenue, they are relatively flat in growth. With this information, strategic leaders may decide to treat Web CMS projects differently than something like Cloud Native Apps that are the fastest growing services, but a small art of the revenue.

.png?width=600&name=image-asset+(1).png)
The change in growth insight segmented by core services.
Another example of a question that might be helpful is the chart where we can see how the project margin is changing compared to the cost of services. If we segment this by services, we can see how our new or emerging services contribute.

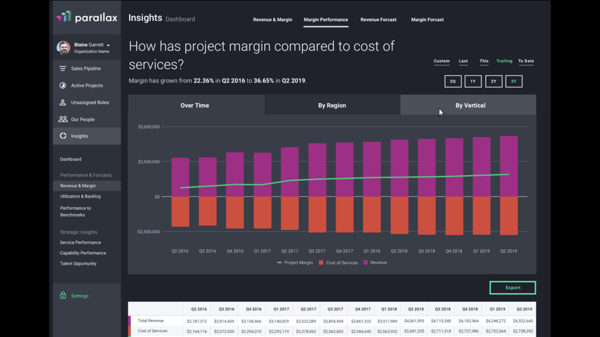
Project margin, compared to revenue and cost of services. We can segment this by a team, vertical, offering, etc.
There are some other business insights that are more operational but very important to many of our advisors such as real-time utilization charts that can be easily segmented by a myriad of dimensions.

.png?width=600&name=image-asset%20(4).png)
One that I personally always wanted was a real-time look at capacity based on the backlog. For this report, in particular, we’ve built in some scenario analysis tools for charting the opportunities in the sales pipeline in the same view.

.png?width=600&name=image-asset%20(5).png)
Finally, we shared a view of the insights dashboard that is meant to share both strategic and operational insights. Things like the backlog by role heat-map, provide a unique view of what could be considered lead times by role. Others like the Top 5 Roles in Hours from the demand pipeline show trends in our sales pipeline that might indicate changes in market.

.png?width=600&name=image-asset%20(6).png)
Please reach out if you want to talk shop!
I wasn’t joking when I said that my wife gives me shit about how excited I am about this stuff. If you want to talk shop or see more of our product please hit me up and I’ll find a time to connect. I love talking about strategy, operations, and of course sharing our vision.